Introduction
Welcome back to the fourth installment of this series on designing, managing and growing a successful security program. Today we’re continuing the discussion on metrics, this time focusing on how to measure program Performance.
In case you missed prior posts, in Part 1 of this series, I gave a brief background on how I became a CISO and outlined the process of defining the security program’s purpose and mission statement. In Part 2, I talked about scoping and organizing the program. Then, in Part 3, I started the discussion of program metrics, by introducing the concept of measuring Capability and why it’s important.
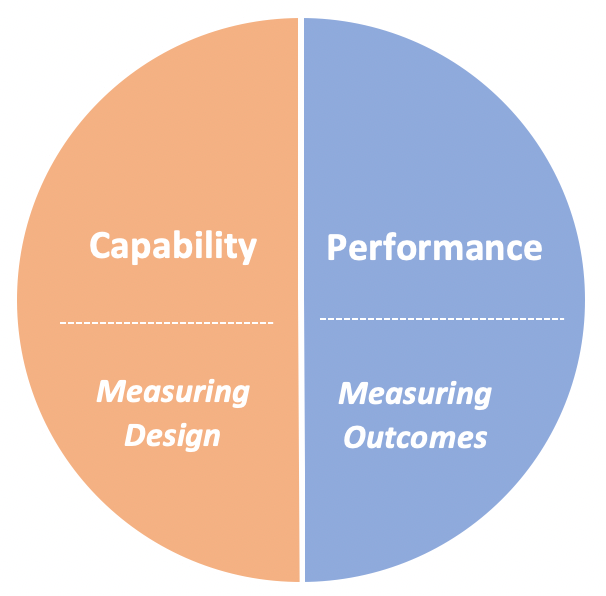
A quick recap of Capability vs. Performance Measures
If you recall from Part 3, I underscored the importance of measuring both Capability and Performance for your security program and outlined the distinction between the two as follows:
- Capability Measures - Is the program aligned with best practice and capable of achieving its defined goals?
- Performance Measures - How well is the program actually doing (i.e. outcomes)
Capability measures speak to the potential to achieve the desired results (i.e. how well the program is designed), while Performance measures speak to the actual outcomes. Together, Capability and Performance measures give a more complete picture of the overall state of your program.
Measuring Performance
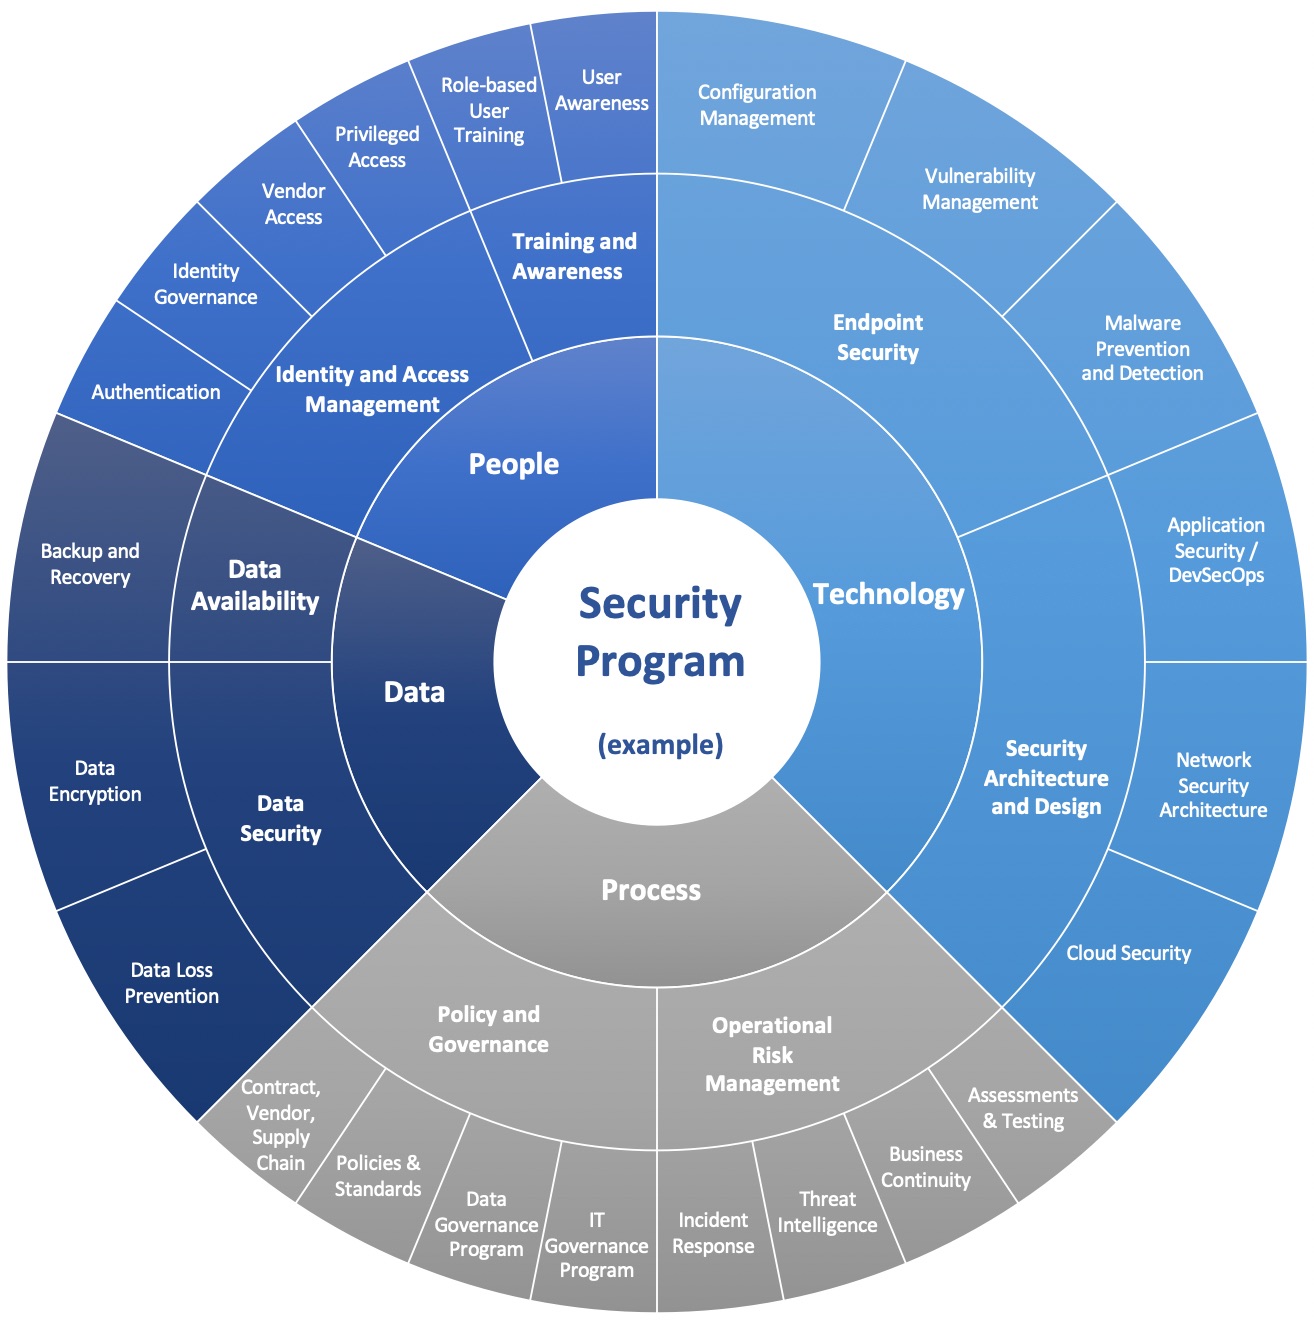
Just like Capability, we’re going to measure Performance for every component of our security program. Again, that’s everything represented on the outer ring of this notional security program visual from Part 2 of this series).
Performance Measures represent Desired Outcomes
Performance Measures are what we use to measure the impact of our security program and assess the gap between actual performance and desired outcomes. But how do we define our desired outcomes for each component of the security program? For that we have to turn once again to our purpose statements. Recall from Part 2, I said that every program component should have a defined scope and purpose. Going through the exercise of defining the purpose for each component of the security program is necessary to establish defined goals and measurable outcomes.
These measurable outcomes become your quantitative measures of success that will help you demonstrate whether you’re meeting your goals and how much of an impact you’re having.
Let’s continue with our Training and Awareness example from Part 3. As a reminder here’s the example purpose/scope.
| Program Component | Purpose / Scope |
|---|---|
| Training and Awareness | Ensure all members of the workforce receive timely and relevant security training and continuous engagement in order to minimize the occurrence of preventable incidents |
Also recall from P 3 that in our fictional organization, we have one primary method of training our workforce members which is enrolling them in mandatory online training. Let’s assume this mandatory training is assigned within 30 days of employment and again thereafter if a user is involved in an incident or after a period of 365 days, whichever comes first. Just to keep things really simple for this example, let’s also assume that we’re only talking about phishing-related training and incidents.
Given the purpose and scope, how would we quantitatively define success for Training and Awareness? Some might be tempted to say a good measure of success would be the total percentage of the workforce that we train, but remember from Part 3 that’s really a measure of Influence, not success. Total percentage of workforce trained only guarantees that we have the ability to influence their behavior with training, not that we’ve actually succeeded. That metric means very little as far as desired outcomes is concerned if those fully trained people continue to cause security incidents!
What we really want to measure here is the effectiveness of our training and its impact on user behavior. To keep things really simple, let’s say we have two methods of assessing our impact on user behavior:
- A workforce member’s involvement in phishing incidents
- A workforce member’s recorded actions from monthly mock phishing tests
Based on our Influence measures in Part 3, we know that the 10% of our Contracted workforce cannot be enrolled in our training platform, so for the sake of this example, we’ll say that a measure of success will be if fewer than 10% of our total population is involved in a phishing incident or contributes to the “click rate” in a mock phishing test. We also want to keep the percentage of people that contribute to an incident more than once in a year (aka “repeat offenders”) to less than 5%. With that in mind, here are our Desired Outcomes:
| Desired Outcomes (Measures of Success) |
|---|
| < 10% monthly mock phishing test “click rate” |
| < 5% incident “repeat offenders” within a one-year period |
| < 10% of the total workforce contributing to phishing incidents |
It's important that you define the quantitative measures that are appropriate for your environment.
We’re once again going to use a standard rating scale for Performance (as we did for Capability in Part 3) so we can normalize our measures across the entire program:
| Rating | Definition |
|---|---|
| None (0) | Program efforts are failing to meet any desired outcomes |
| Low (1) | Program efforts are not meeting most desired outcomes |
| Moderate (2) | Program efforts are meeting most desired outcomes, though not consistently |
| High (3) | Program efforts are consistently meeting nearly all desired outcomes. |
| Optimized (4) | Program efforts are consistently meeting or exceeding all desired outcomes |
Since we’re getting all of the relevant data fed into our SIEM, we can track the month-over-month metrics to assess our Performance measures.
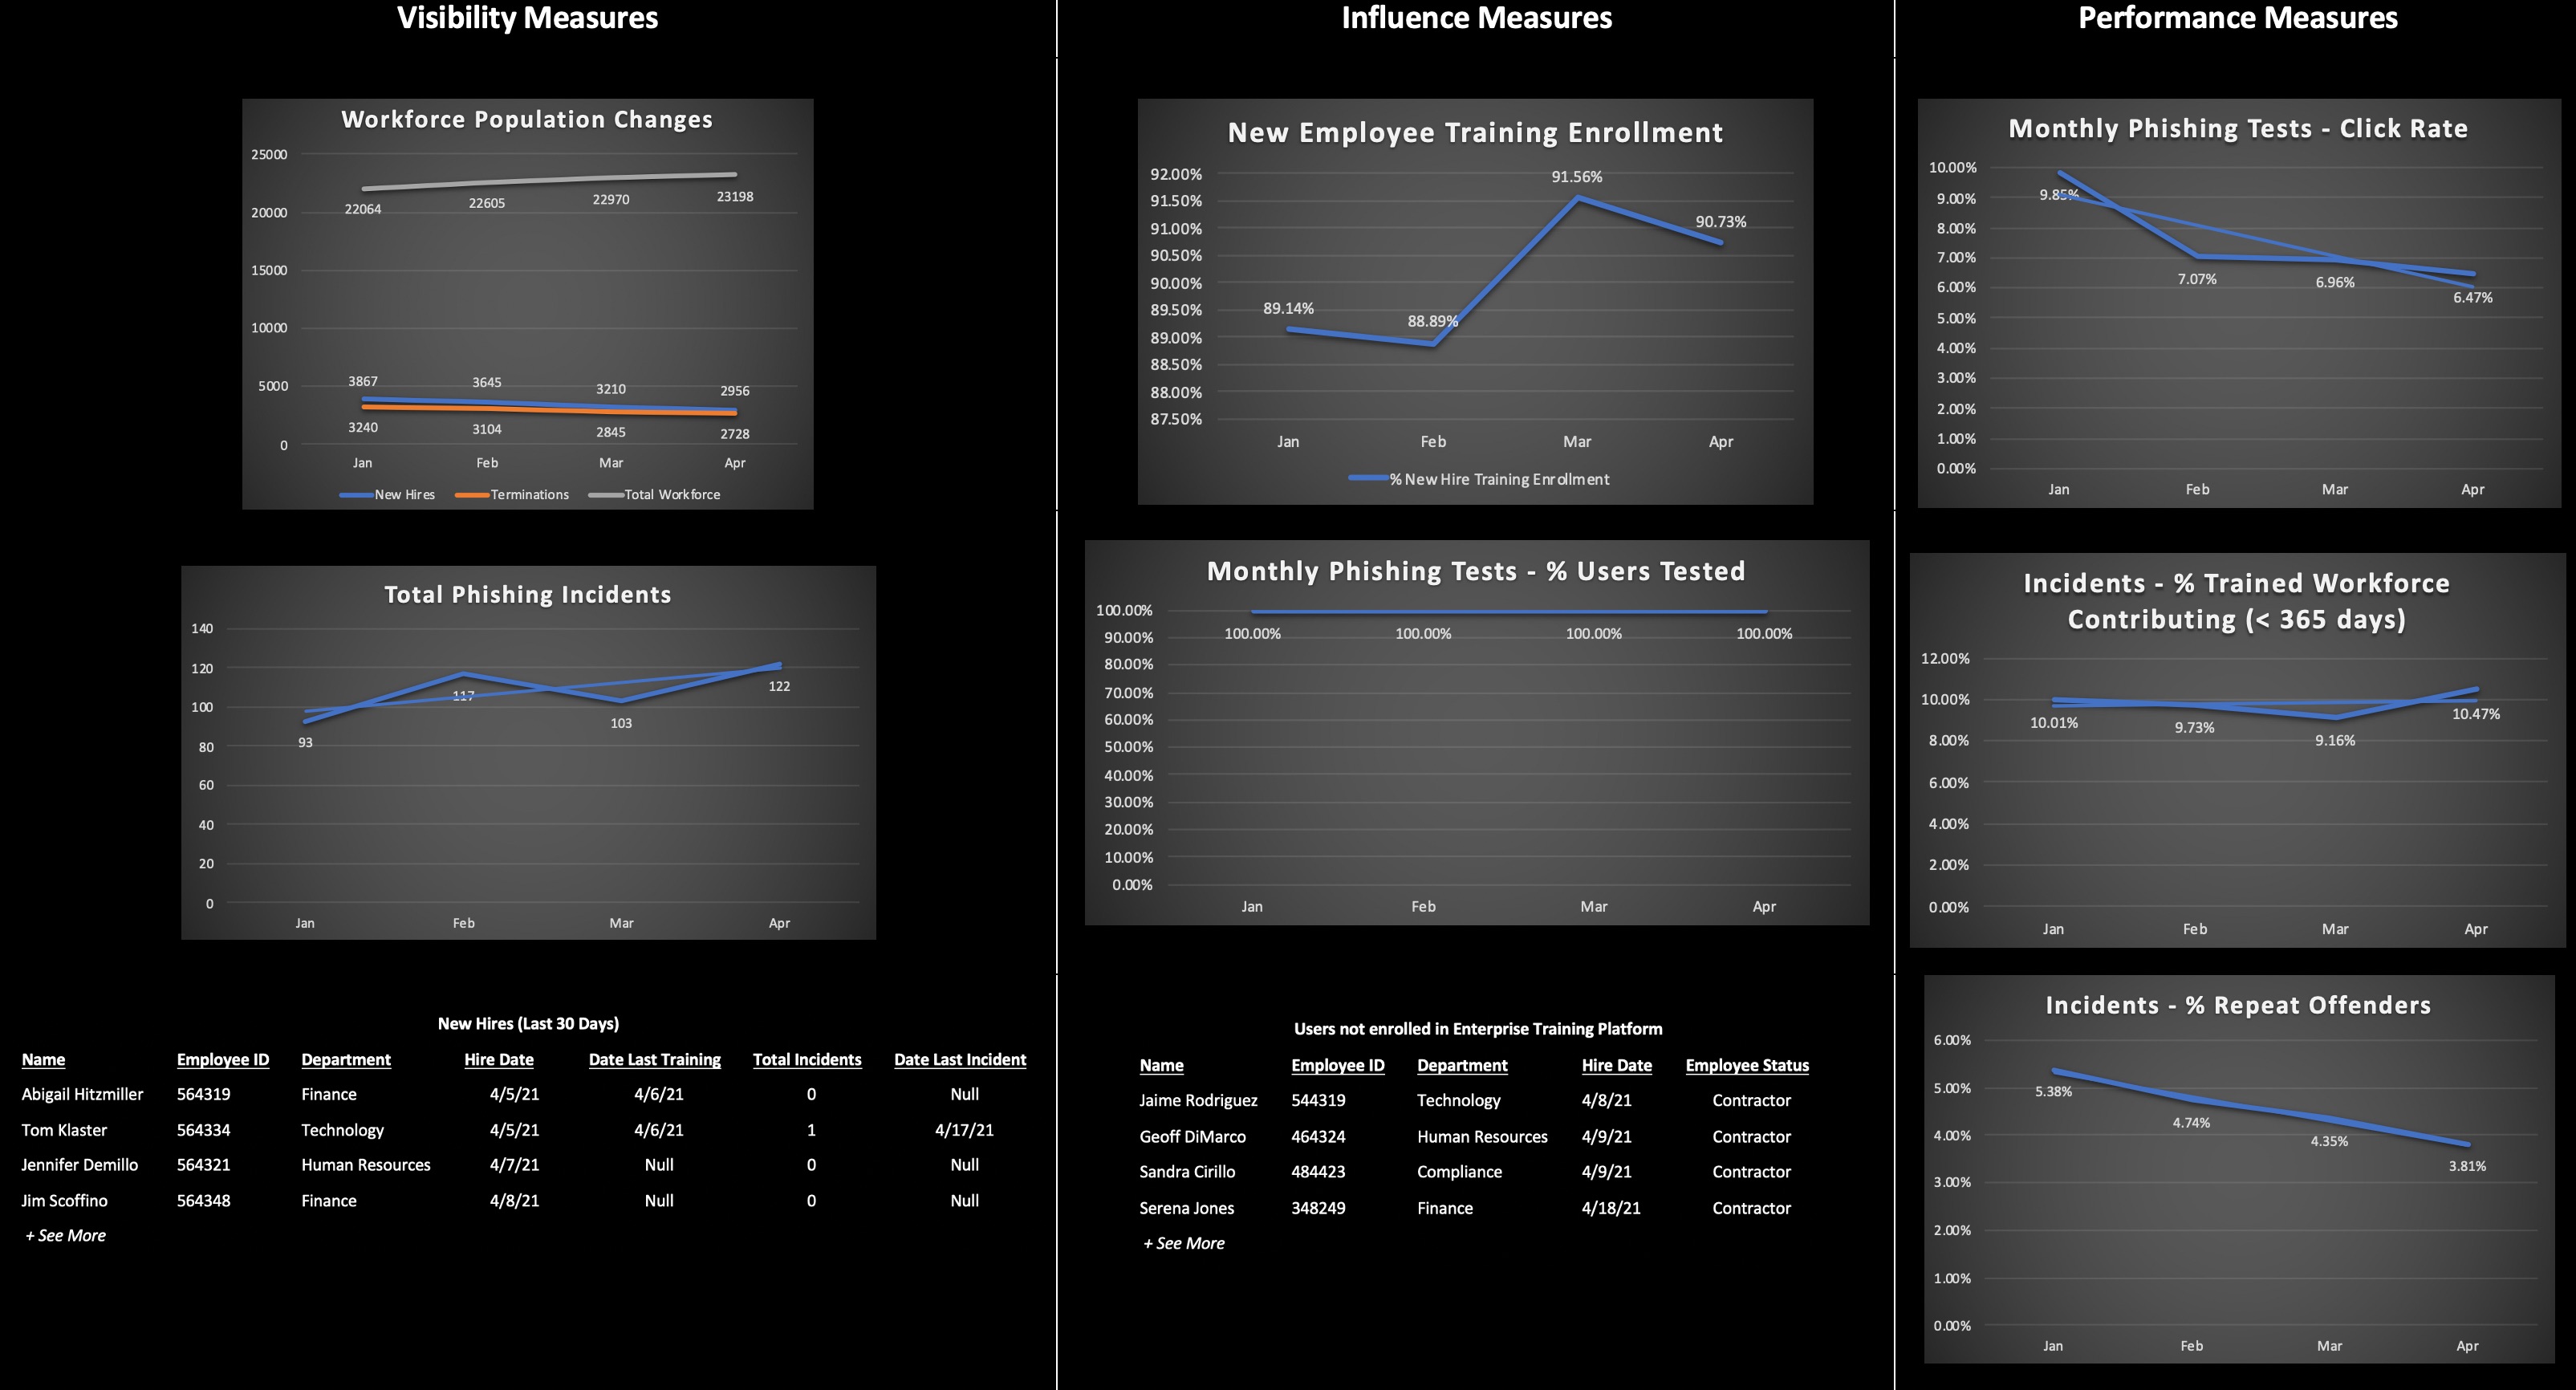
From the metrics dashboard, we can see from our monthly mock phishing tests that we’re consistently meeting our desired outcome measure of < 10% with an overall downward trend. The percentage of trained workforce members that contribute to phishing incidents has been close to meeting or exceeding our goal, though we saw an increase in April that caused us to fall short of our goal for that month. We’ve also seen an overall downward trend for repeat offenders and we’ve exceeding our Desired Outcome of < 5% every month since January.
Based on the rating criteria above and taking into account that we are meeting most of our defined goals (with the exception of one in April), we might rate ourselves High (3) for Performance. But we don’t necessarily want to stop there. We’re going to want to understand why it’s a 3 and what it will take to improve it (if necessary). We may also need to analyze additional data to explain potential anomalies or trends.
In our example, maybe there’s a reason why the number of trained workforce members involved in incidents rose while mock phishing test click rates continue to decline. Perhaps the mock tests are not representative of actual phishing incidents, so users are able to easily recognize those, but still get tricked by the real thing. And given what was discovered in Part 3 about our lack of influence over the 10% of the contracted workforce, we may also want to determine if that factors into these performance measures. Perhaps the users that are contributing to incidents or clicking on mock phishing tests are mostly untrained Contractors.
Further exploration of the data may also help identify more specific areas in which we want to focus improvement activities that would otherwise go unnoticed. For example, if we further divide the Performance metrics by business unit, perhaps we’ll find departments that are contributing more to risky behavior than others. Maybe that will lead us to identify departments that routinely open unsolicited email from external stakeholders as part of their workflows and would benefit from additional or more targeted training.
Visualizing and communicating your program measures
Now that we have identified and can explain the Capability and Performance Metrics for every single component of our security program, we can better visualize the overall state of the program and present it to executives and other stakeholders. Let’s walk through how we might do this.
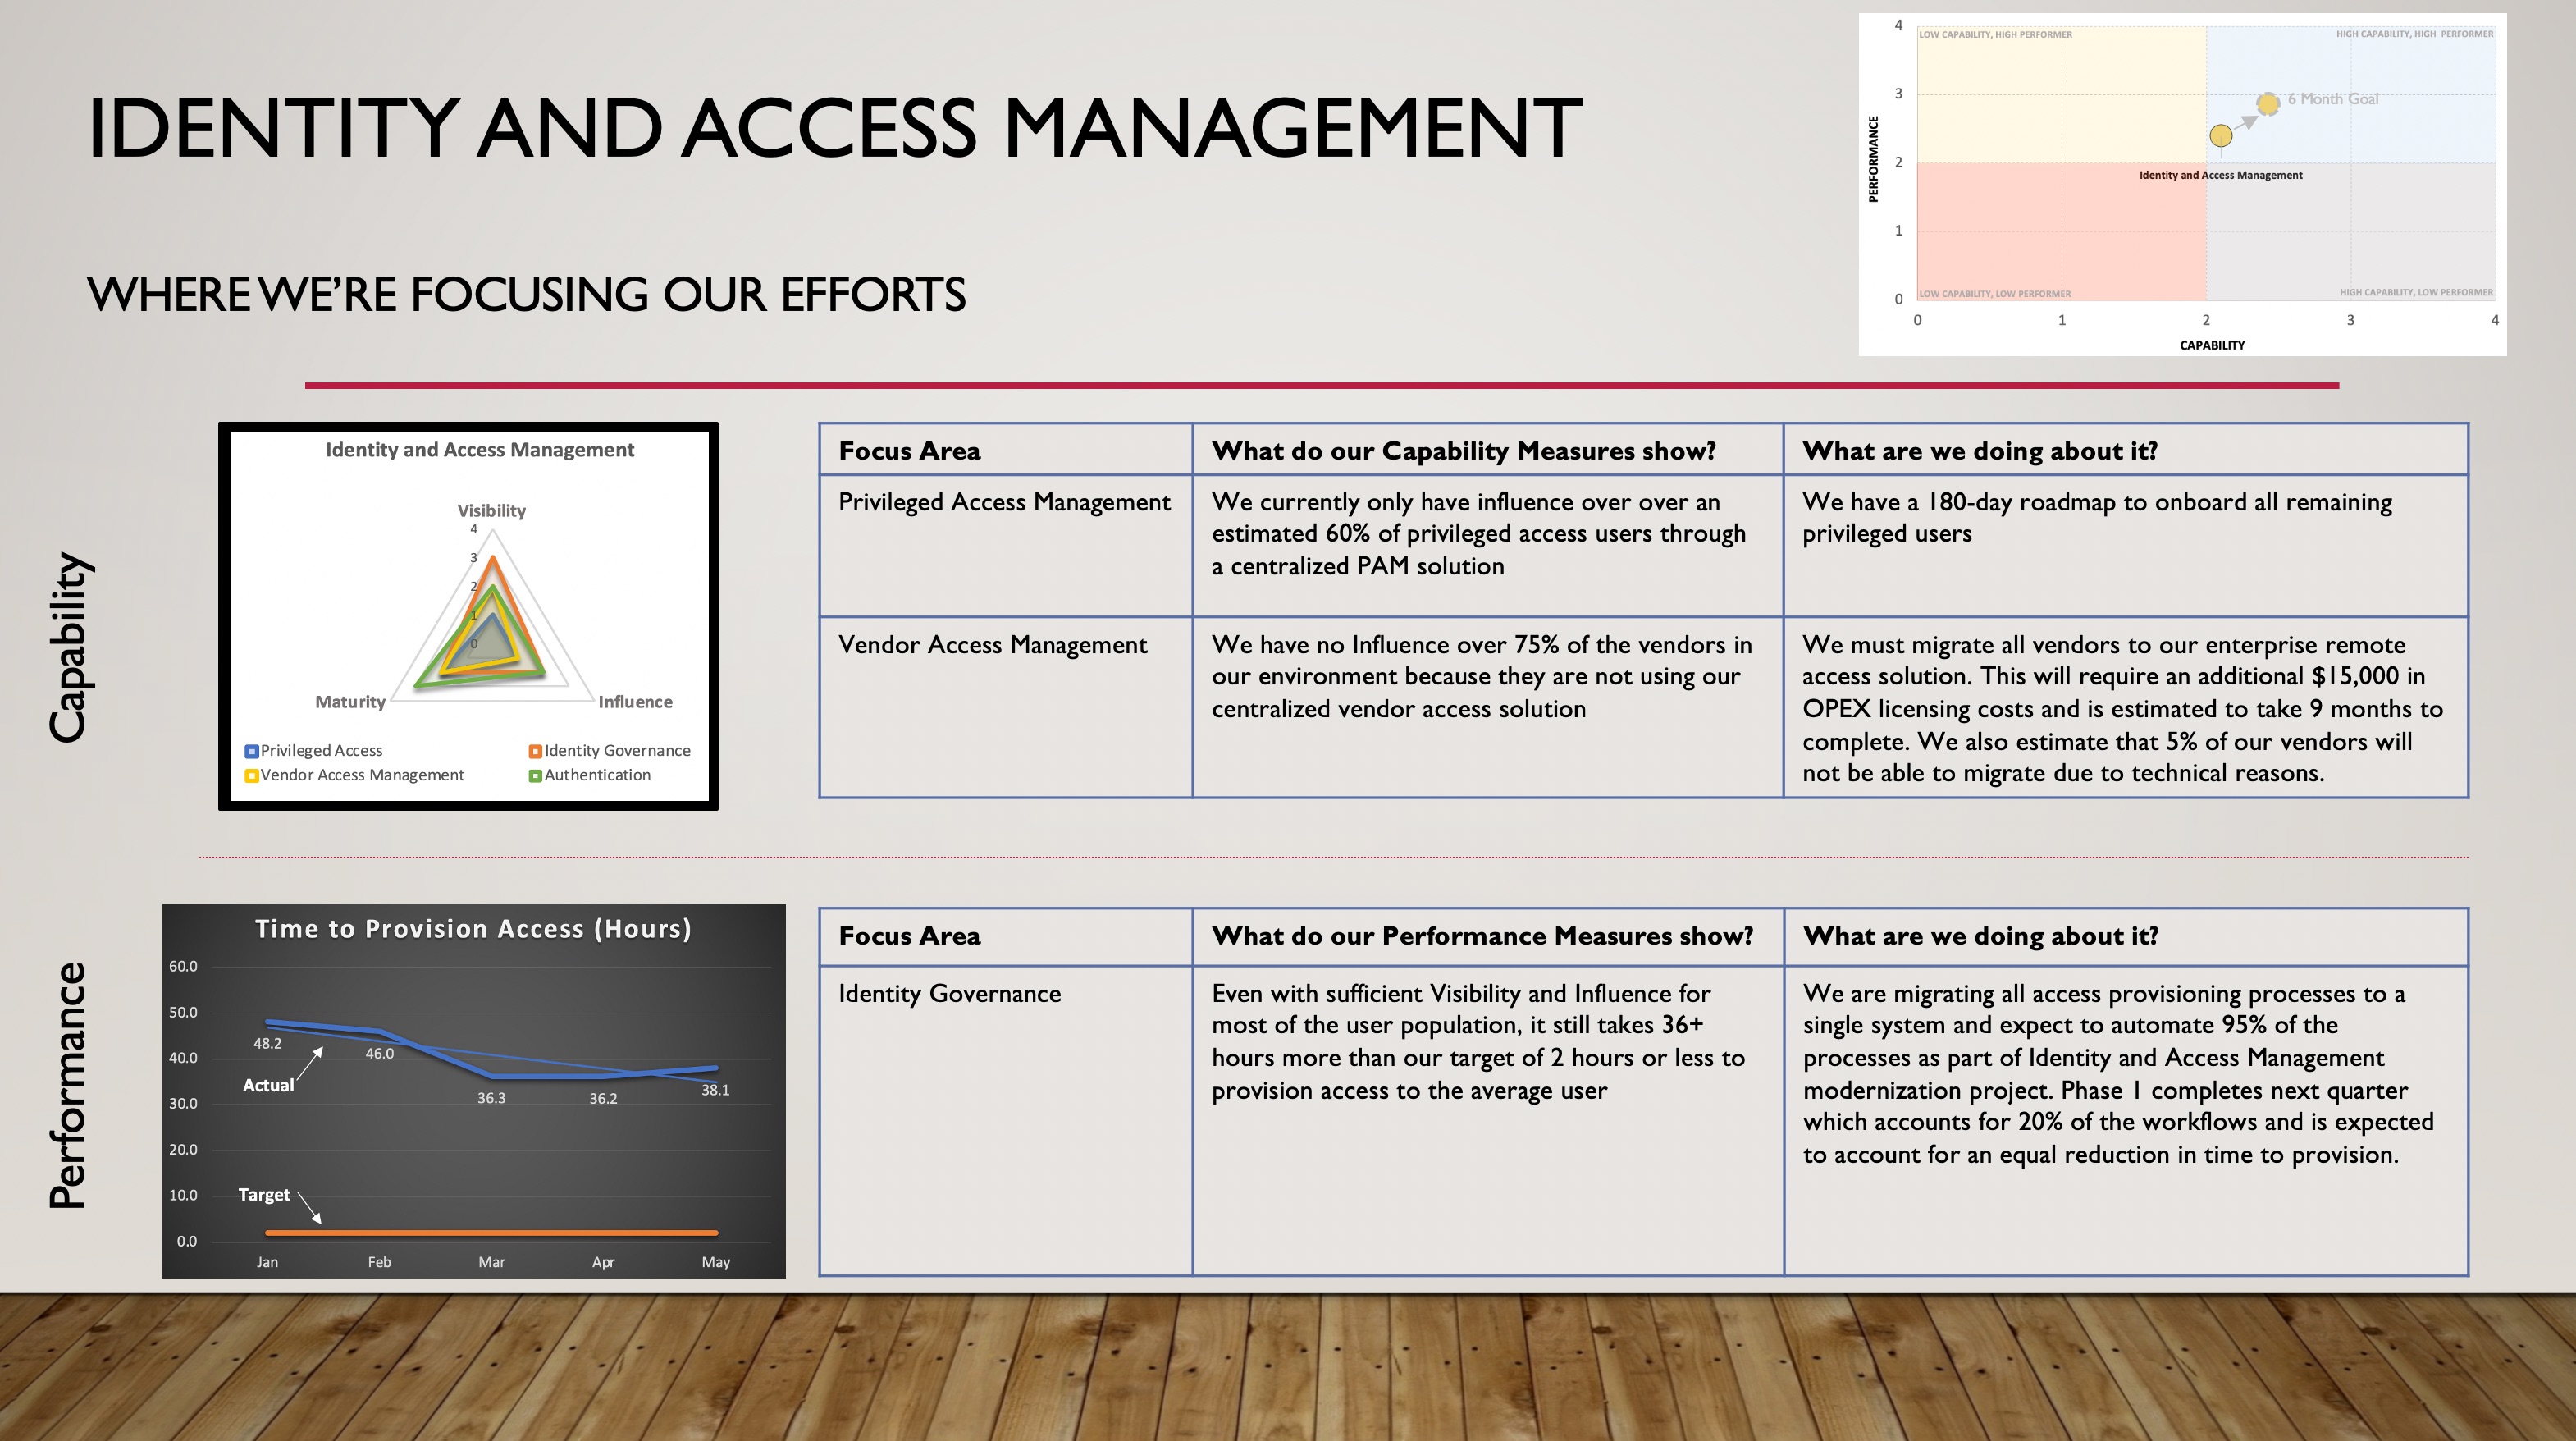
Assume we’ve measured Capability for each area within the Identity and Access Management component of our Security Program, which is represented by the following spider chart.
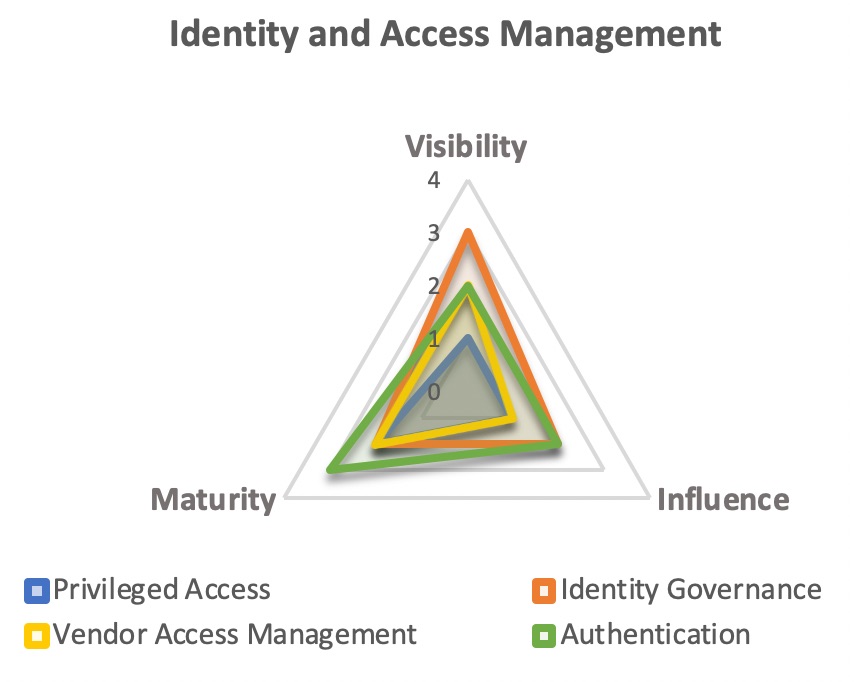
We should also have a corresponding Performance measure for Privileged Access, another for Vendor Access Management, and so on. While we could leave it at this level of granularity, let’s assume we’re developing an Executive-level dashboard and we want to roll these measures up to a single Capability and Performance measure that represents the entirety of Identity and Access Management.
In order to get the overall Capability score we can simply take an average of the four areas – let’s assume that comes out to 2.1. [Note: you might decide to use a weighted average if some areas are more impactful than others]. We’ll do the same for the respective Performance measures and then plot Capability and Performance together on a very simple visual:
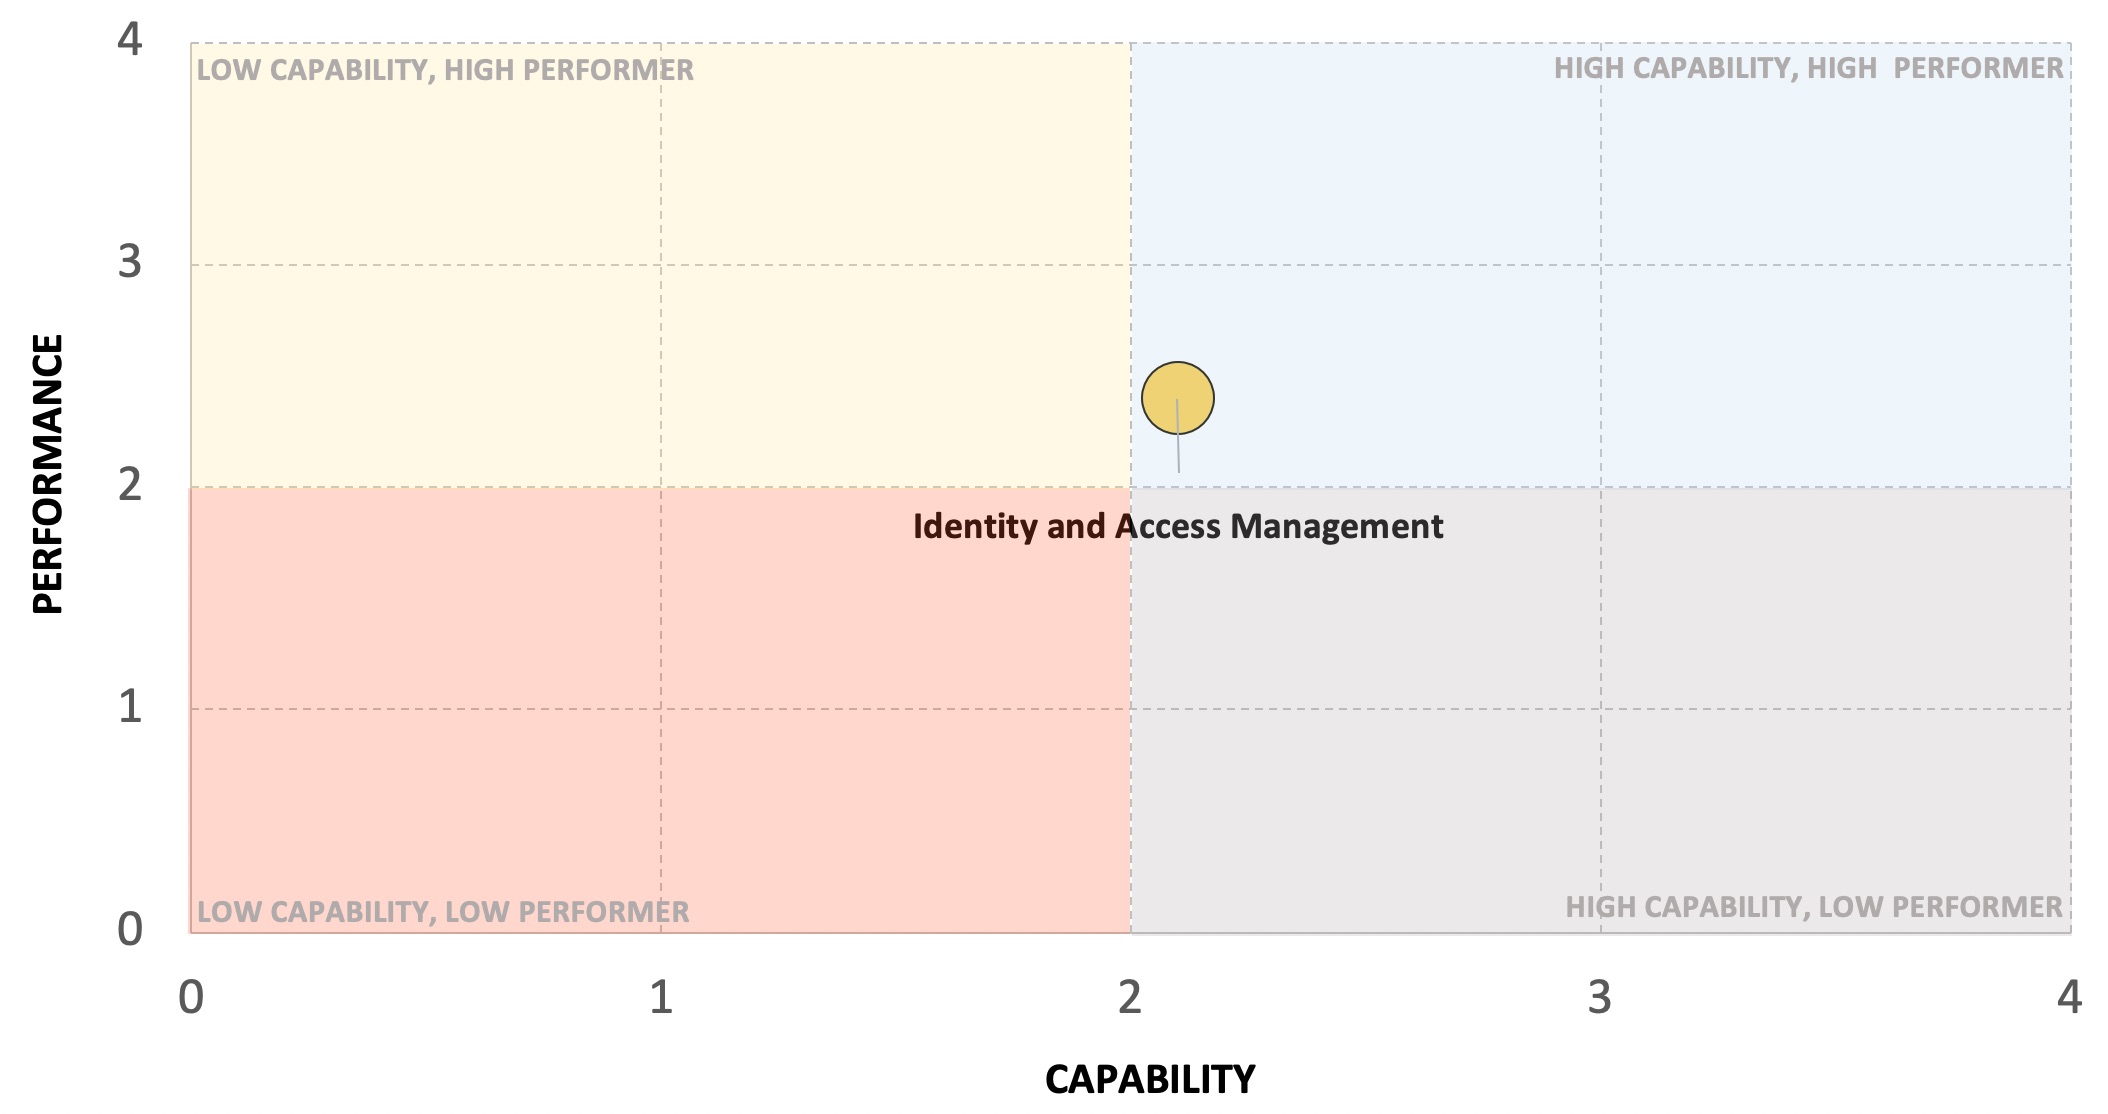
We can repeat this exercise for the rest of the program components to get a comprehensive view.
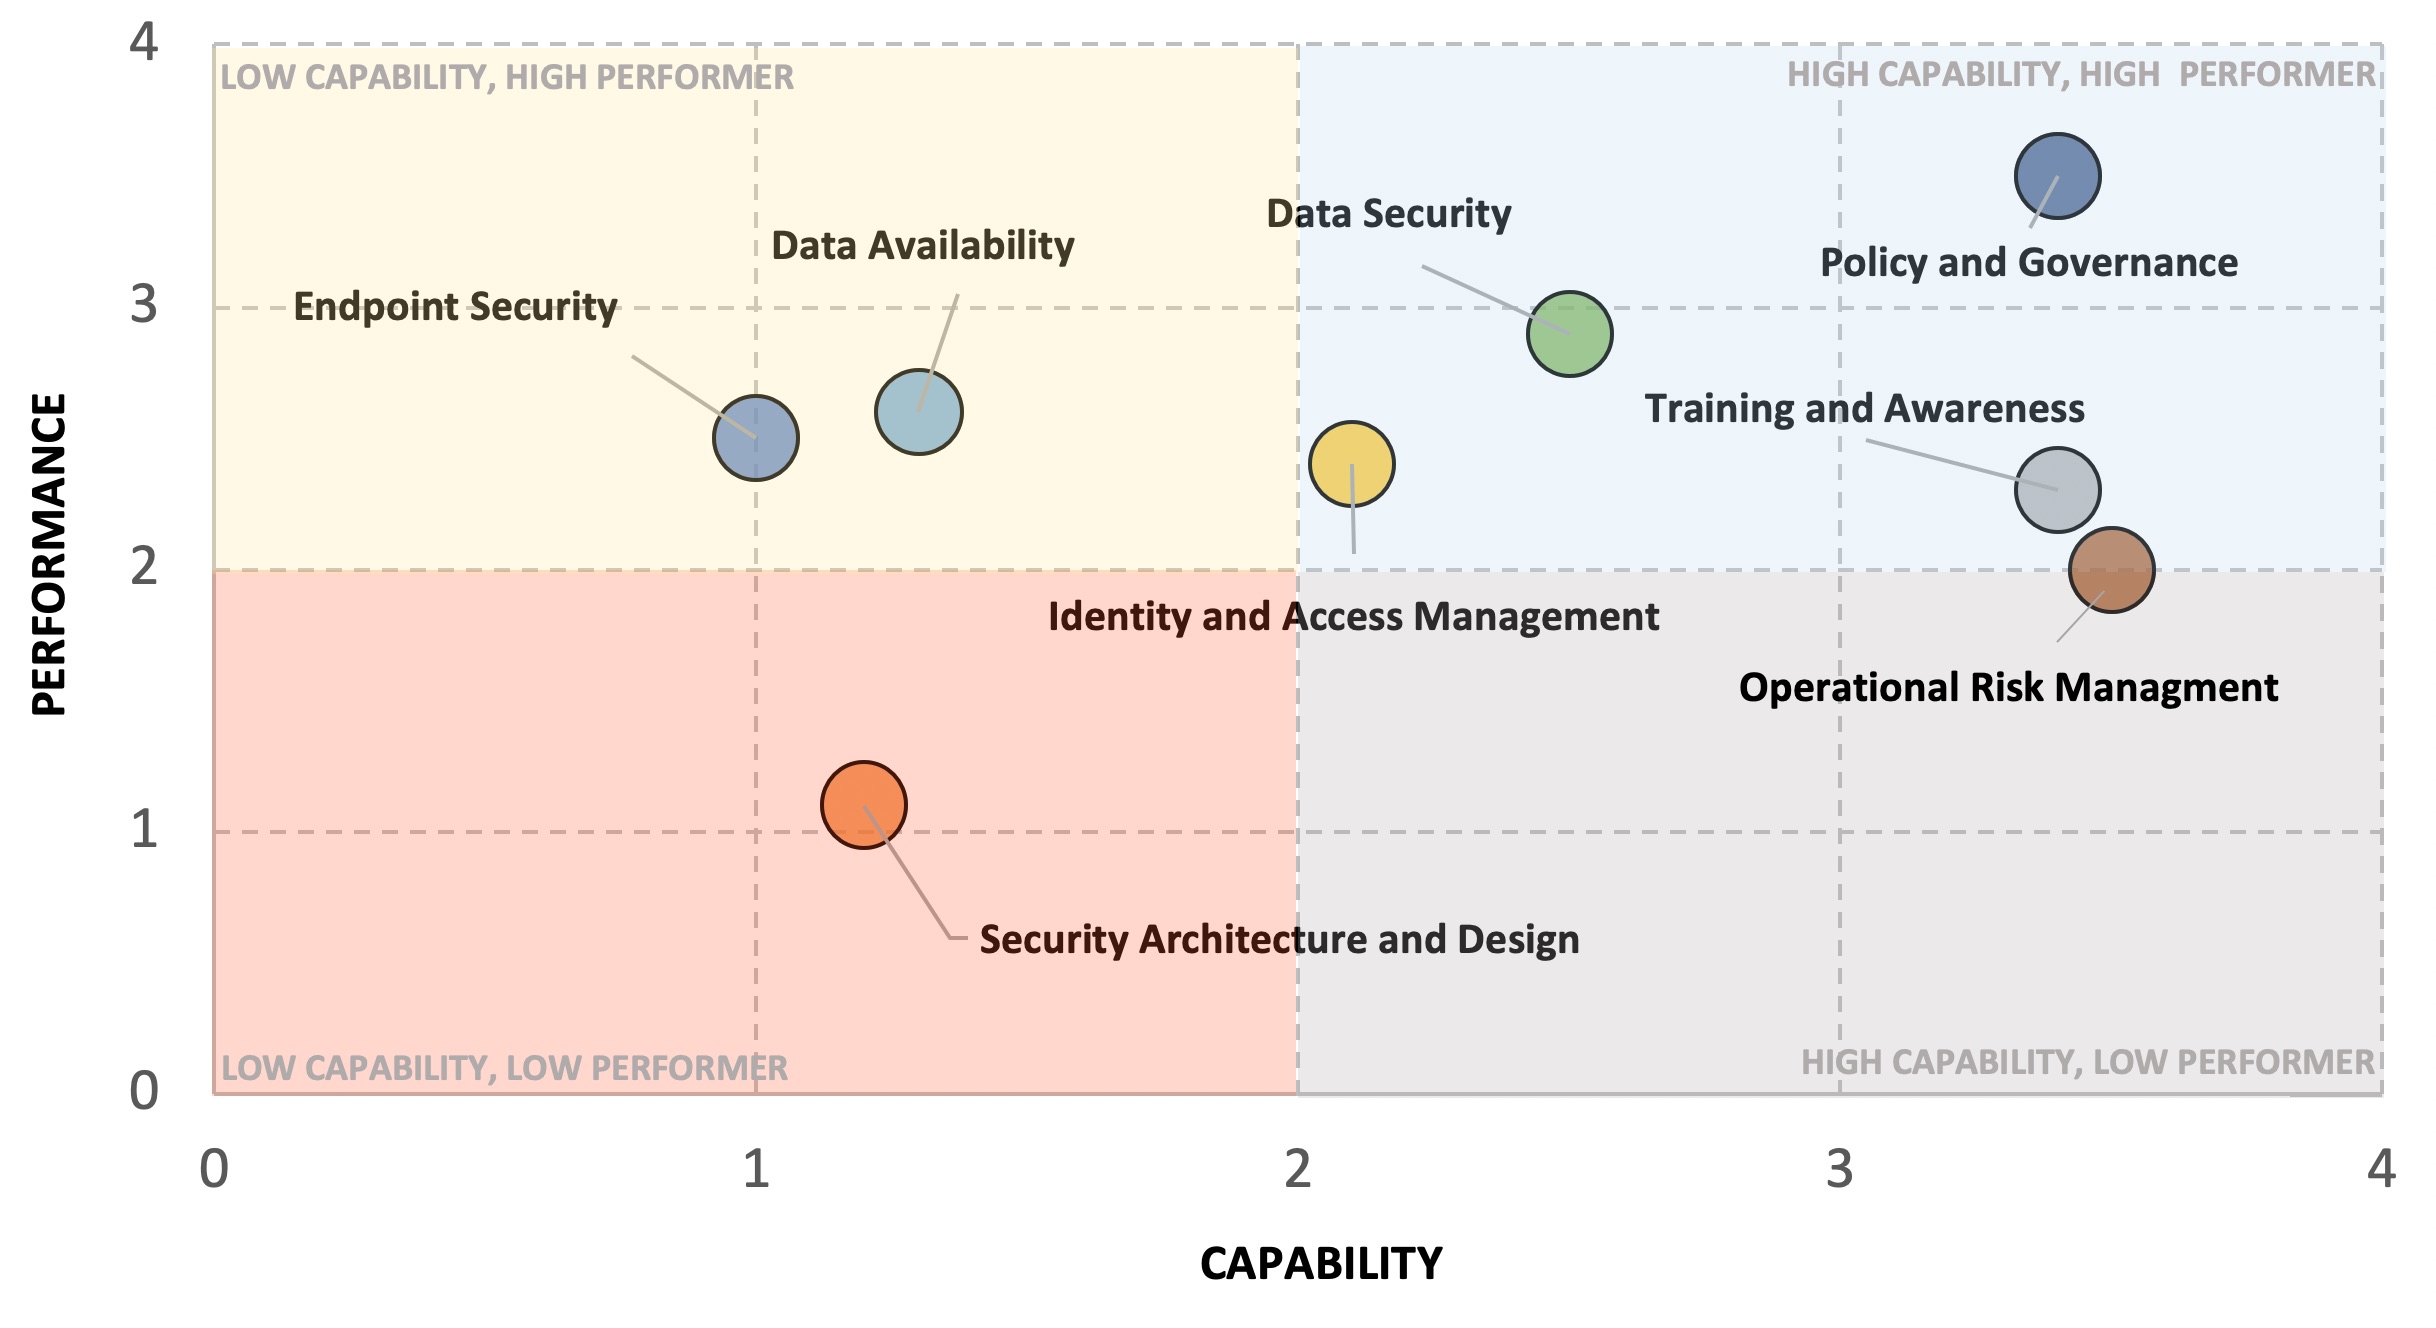
One more thing we haven’t covered is how to convey priority or importance. Taking a look at the above visual, we can see that there are a number of areas where we may need to improve Capability, Performance, or both. Assuming we don’t have enough resources to do everything at once, how do we clearly illustrate which areas of the security program should be prioritized?
There could be several factors we look at (cost, timing, etc.) but one key piece of information that’s missing from this view is the overall importance these functions play in either 1) reducing our risk or 2) enabling the organization. Perhaps improving Capability and Performance of Security Architecture and Design (via a DevSecOps program) would not only significantly reduce security risk but would also help accelerate time-to-market for key products. You can represent overall importance or expected impact by changing the size of the circle – the larger the circle for a given area of the security program, the higher its importance in overall risk reduction / business enablement.
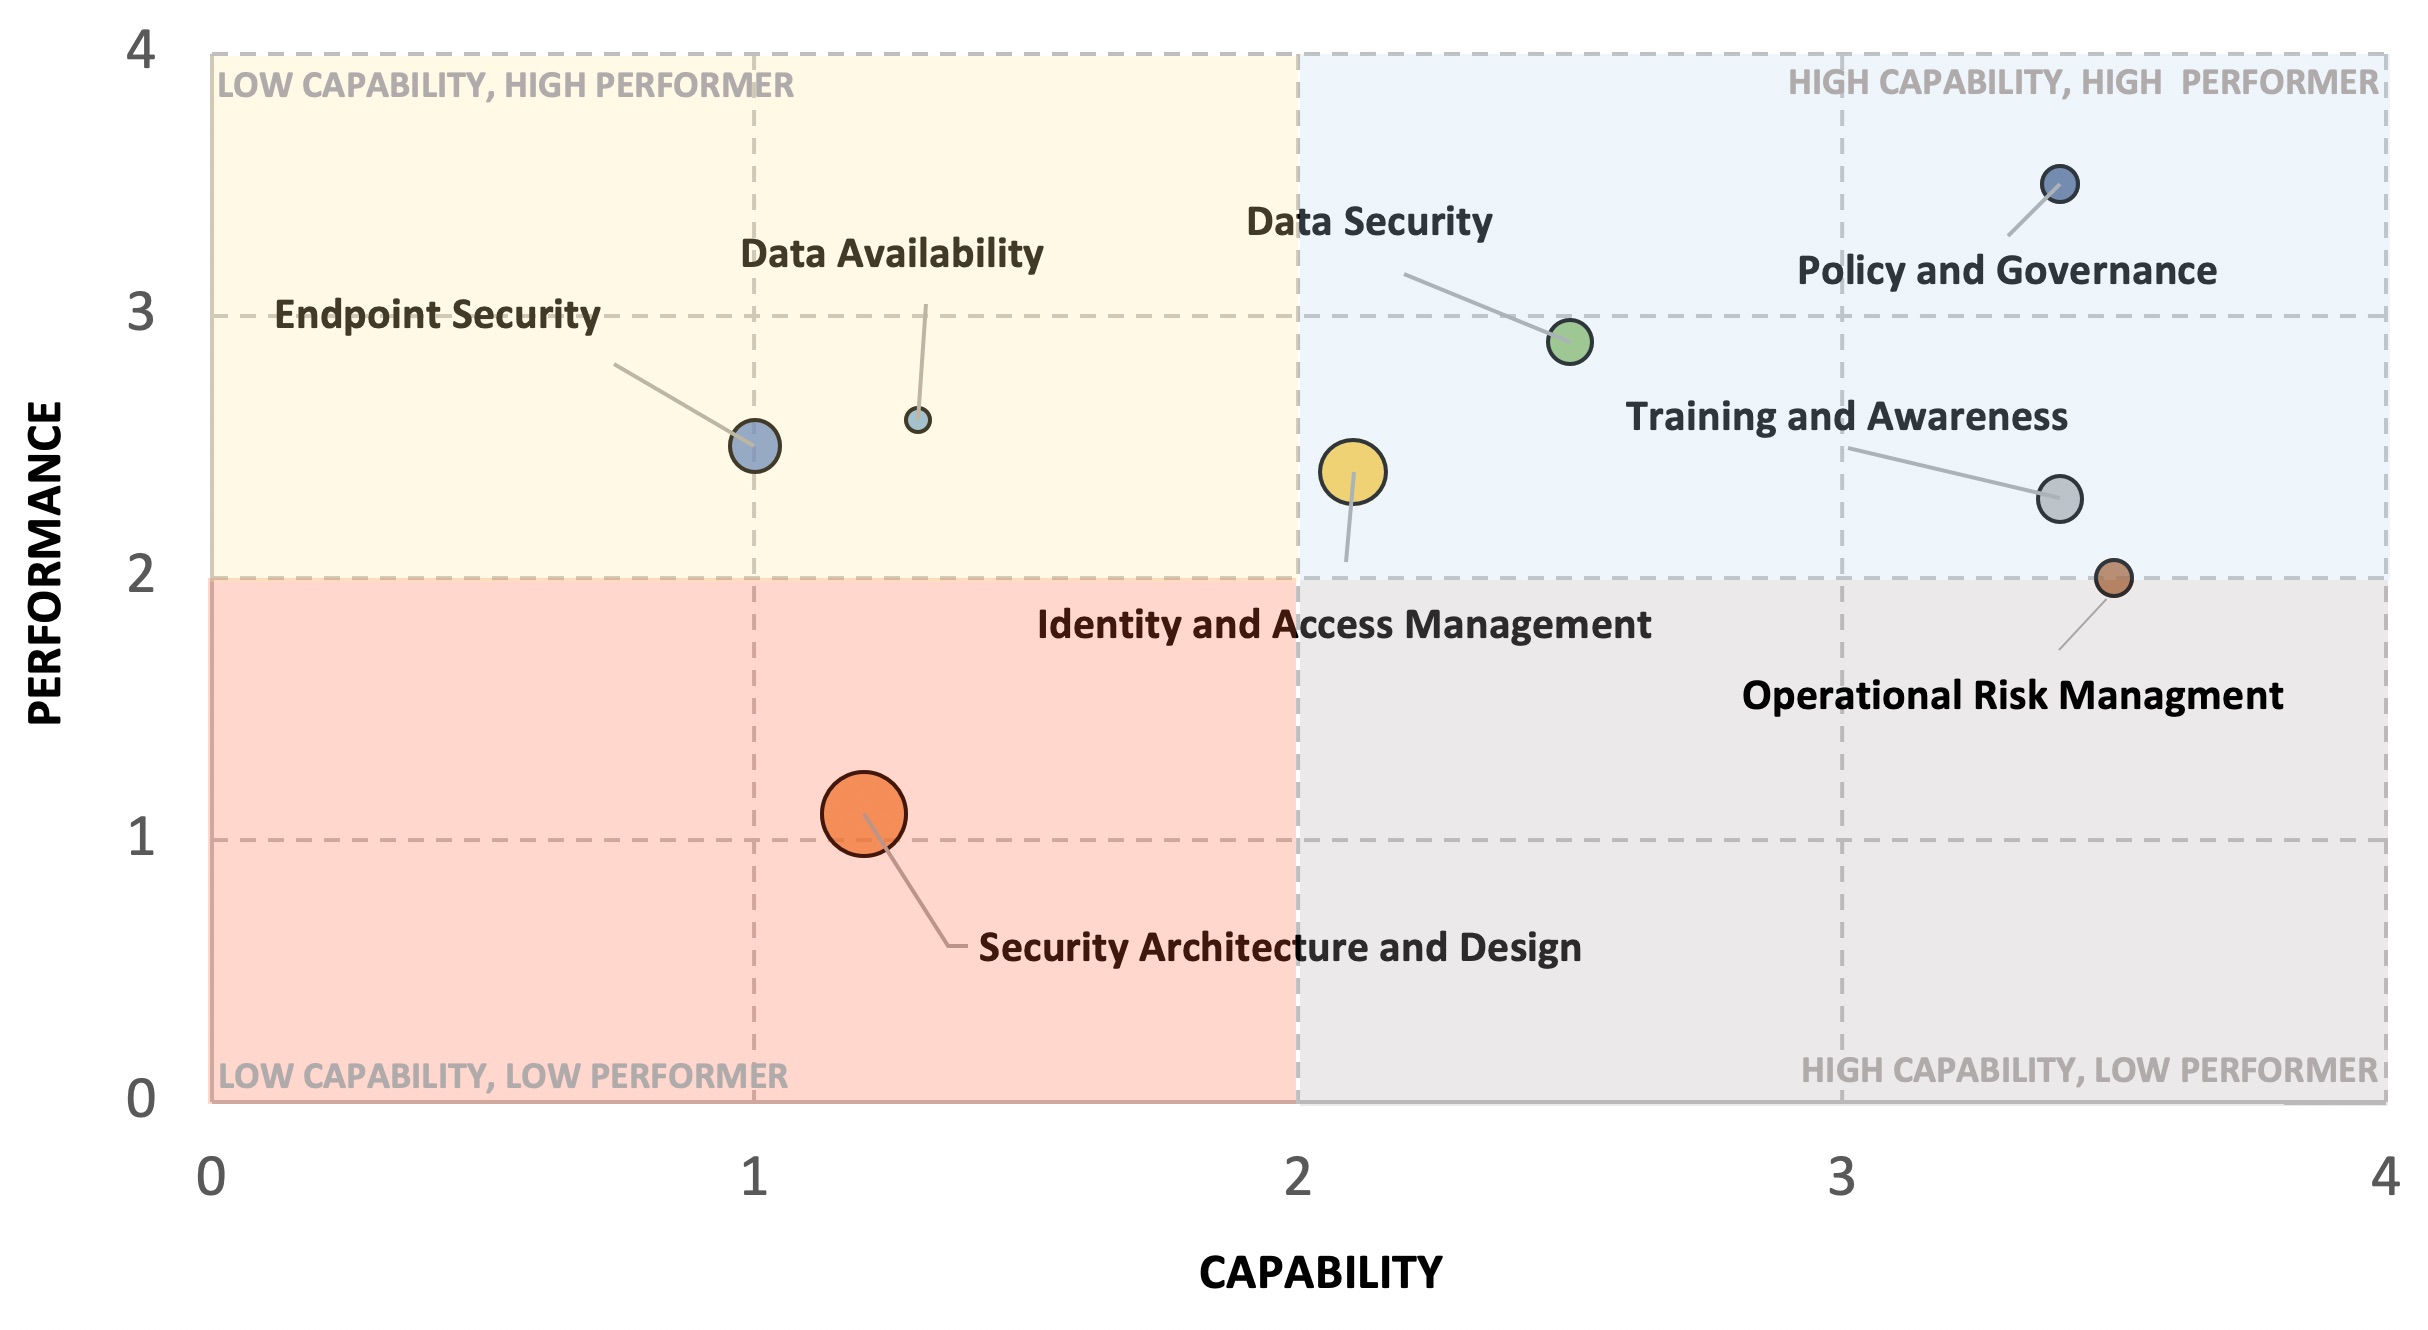
Finally, we might want to add something that reflects changes from the last reporting period as well as an overall trend for each component of the security program, which could be represented as follows:
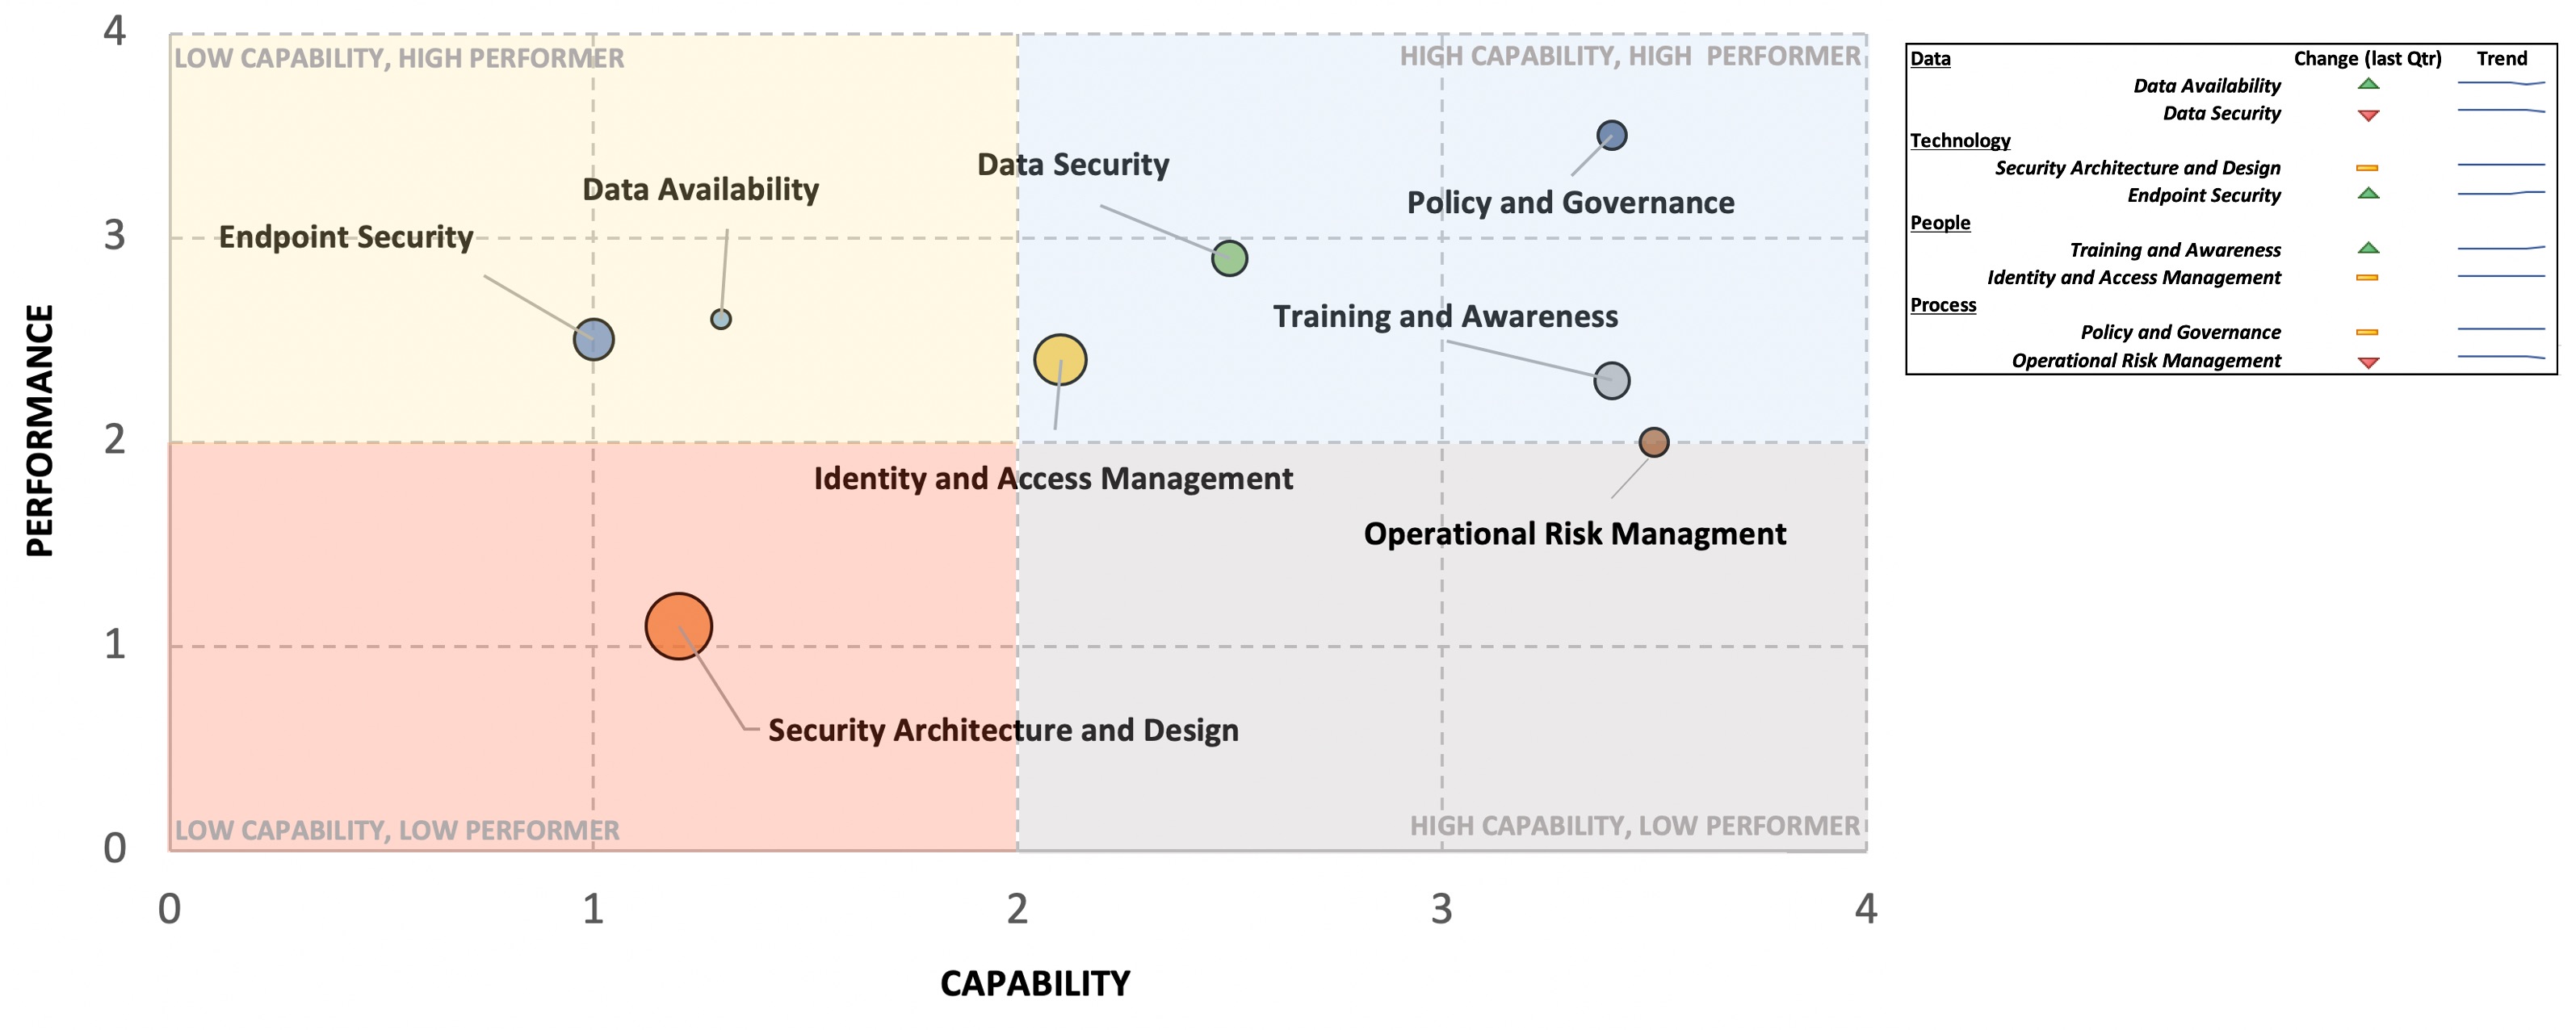
A visual like this makes it relatively easy to communicate the state of your program, giving a 50,000-foot view and drawing attention to the areas in which you need to prioritize further investment/activity.
And since you’ve gone through the exercise of measuring Capability and Performance, you have the underlying data, which you can use to drive those more in-depth conversations.
Explaining Relationhips or Discrepencies between Capability and Performance
Sometimes low Capability measures can lead to low Performance measures, but be careful about assuming causation between the two. You may have two very different issues causing those low scores and improving your Capability may not result in an equal improvement in Performance. Similarly, discrepancies between Capability and Performance (where one is Low and the other High) should also be further explored before assuming any causal relationship. Here are a couple of reasons why that could be the case:
-
Low Capability / High Performer - This could be an indicator that your Performance Measures are not representative of your total population (as indicated by low Capability score). For example, your Performance measures may show that you’re consistently exceeding your 15-day time-to-patch goal on all of the endpoints you’re monitoring (giving you a high Performance score). However, your Visibility and Influence metrics actually show that you’re only monitoring and impacting 60% of the total endpoint population. While it’s great that you are performing well for the endpoints that you can measure, you also clearly have a gap in Capability (which underscores why Performance metrics alone don’t always tell the whole story).
-
High Capability / Low Performer - You may have relatively good Visibility and Influence but perhaps the processes that you rely on to effect change are inefficient. For example, maybe you have an automated endpoint management tool that can centrally push software patches for every endpoint in your environment (giving you a high level of Influence). However, delays caused by inefficient manual approval steps injected into that automated workflow continue to cause you to miss your performance goals. In other words, you have a high degree of confidence that you can Influence the entire target population, but you’re not executing very efficiently, as reflected in your Performance measures.
Closing Thoughts
Hopefully over these last two posts I’ve demonstrated the importance of measuring both Capability and Performance in order to give a holistic view of the state of your security program. The benefit to an approach like this it is very thorough but also relatively straightforward to communicate because it doesn’t rely on complicated measurements or security-industry jargon.
“We can see it”, “We can do something about it”, “We’re aligning to best practices”, “We’re meeting our goals and having the following impact…” – These are all concepts that most stakeholders should be able to grasp pretty quickly. And, because you’ve taken the time to define and track quantitative measures, you can delve into the details when necessary.
These measures can be instrumental in justifying new projects or budget and staffing increases by providing an objective assessment of the current state of the security program.
What’s Next?
We’ve covered Capability and Performance measures but one thing we haven’t touched on in any detail is how to measure risk … something that’s imperative for any security program. I plan to devote at least one post in this series to that topic, but before I do, in Part 5 I’m going to share my thoughts and tips on becoming what is often referred to as a “business-focused”, “business-centric”, or “business-aligned” CISO.
So stay tuned for that post, but in the interim I enjoy connecting with and learning from others, so reach out to me on LinkedIn and Twitter.